


Model Portfolios | March Update
S&P 500 5954.50 :: 10-Year UST Yield 4.22% :: March 1, 2025
“Capital goes where it is welcome and stays where it is well treated.”
-Walter Wriston
COMMENTARY
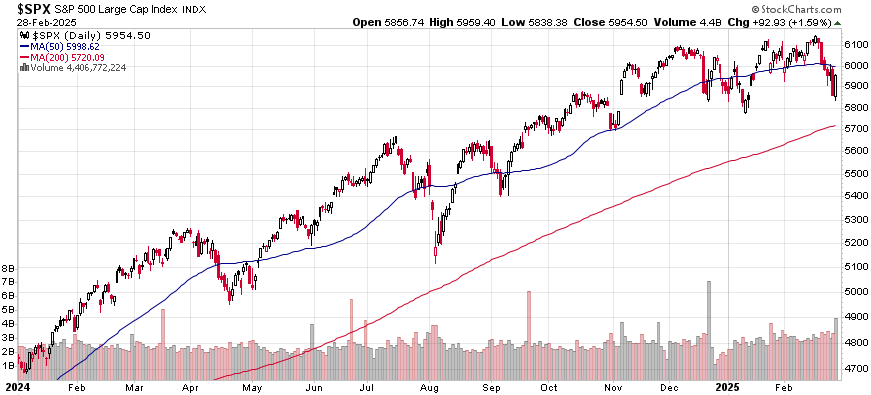
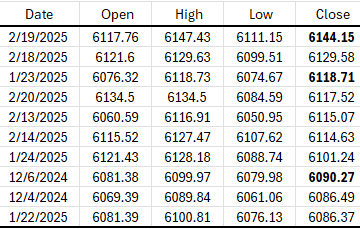
The S&P 500 has been oscillating around the 6000 level since November. The S&P 500 closed at 5954.40 at the end of February, which is -3.1% from its all-time closing high level of 6144.15 achieved on February 19th. As in January, the S&P 500 made two new closing highs on back-to-back trading days during February, barely above the prior month’s closing high. Again, these new highs were immediately met with increased selling pressure. Below is a list of the ten highest S&P 500 closing levels, all occurring over the past three months. The bolded figures identify the closing highs achieved in December, January, and February. As you can see, all of the closing highs from early December through the end of February are within a narrow 1% range.
Money Market Assets climbed to $6.97 trillion in late February, including $2.81 trillion in retail accounts. Here is a link to our recent post highlighting the most attractive money market and CD rates. We publish a mid-month update with the best rates available nationwide every month.

HOUSING MARKET UPDATE
The NAHB/Wells Fargo Housing Market Index (HMI) measures conditions in the single-family housing market. The index fell 5 points in February from 47 to 42. HMI Index readings above 50 are indicative of favorable single-family home builder sentiment. The current sales conditions index fell 4 points to 46, the measure of sales expectations over the next six months dropped 13 points to 46, and the prospective buyer traffic index declined 3 points to 29. The NAHB Chief Economist noted, “With 32% of appliances and 30% of softwood lumber coming from international trade, uncertainty over the scale and scope of tariffs has builders further concerned about costs.” Regionally, the Northeast remained the strongest, falling 3 points to 57. The South held steady at 46. The Midwest fell 2 points to 45, and the West remained the weakest, falling one point to 39. Unfortunately, much of the recovery in the homebuilder index since the August 2024 low was erased in February.

INFLATION UPDATE
The Fed’s preferred inflation measure is the personal consumption expenditures (PCE) price index. In January, the headline PCE inflation rate was 2.5% year-over-year. The core PCE inflation rate, which excludes the volatile food and energy components, was 2.6% year-over-year in January. The 3-month annualized core PCE inflation rate has decelerated from 2.9% to 2.4% over the past few months; however, the 6-month annualized core PCE inflation rate increased from 2.4% to 2.6%. The 3-month, 6-month, and 12-month core PCE inflation rates remain roughly one-half percent above the Fed’s 2% inflation target. FOMC members want inflation to decelerate before lowering the fed funds rate again.
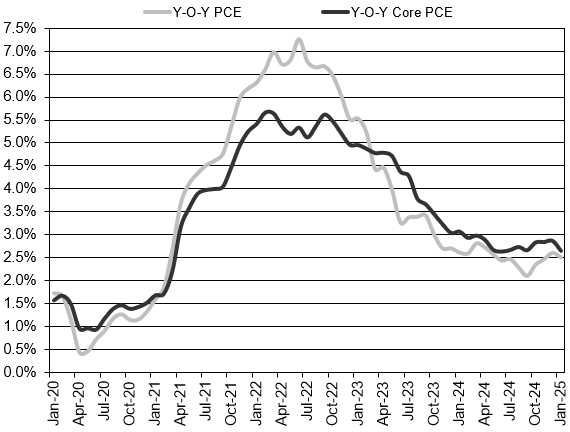
Headline PCE:
+0.3% seasonally adjusted in January, following 0.3% in December
+2.5% year-over-year
+2.9% latest 3 months annualized
+2.6% latest 6 months annualized
Core PCE: (excludes food and energy)
+0.3% seasonally adjusted in January, following 0.2% in December
+2.6% year-over-year
+2.4% latest 3 months annualized
+2.6% latest 6 months annualized
FEDERAL RESERVE UPDATE
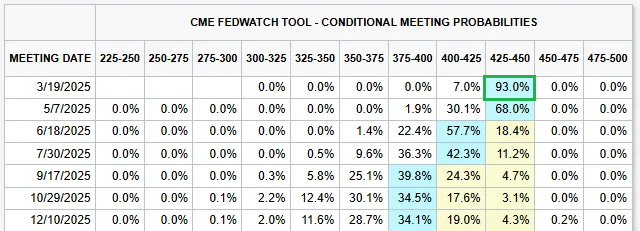
The next FOMC Meeting is scheduled for March 18th and 19th. The meeting will include an updated Summary of Economic Projections (SEP) from FOMC members. Here is a link to their most recent December 2024 projections. We will be looking to see if the central tendency of the year-end 2025 federal funds rate projection is unchanged or slightly higher than the 3.6% to 4.1% range. We do not anticipate any monetary policy change at the March meeting. CME FedWatch probabilities show a greater than 90% expectation of no change to the fed funds rate.
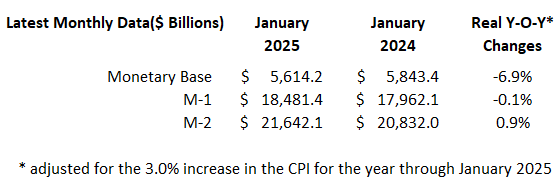
MONEY SUPPLY
MODEL PORTFOLIOS UPDATE
Below is the monthly update of the Marketimer and Brinker Fixed Income Advisor Model Portfolios through February 28, 2025.
Keep reading with a 7-day free trial
Subscribe to Brinker Advisor to keep reading this post and get 7 days of free access to the full post archives.