


Model Portfolios | April Update
S&P 500 5611.85 :: 10-Year UST Yield 4.22% :: March 31, 2025
“The only thing you can be sure of is that there are times when large numbers of stocks are priced too high and other times when they're priced too low.”
COMMENTARY

The S&P 500 has declined 9% from its all-time high achieved on February 19th through its March 31st close at 5811.85. The S&P 500 currently trades around the same level as it did nine months ago in July 2024. The selloff has been more severe in the tech-weighted Nasdaq Composite, which has declined 14% from its all-time high made in December 2024. Investors have shown little interest in purchasing stocks, despite an aggregate of $7 trillion in money market assets at the end of March.
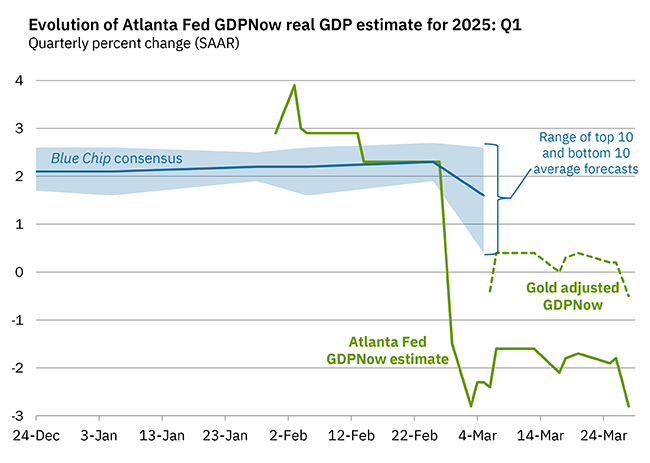
Investors are growing increasingly concerned about an economic slowdown and a rise in inflationary pressures. The Atlanta Fed is publishing an alternate GDPNow real GDP forecast of -0.5% for the first quarter, making adjustments for imports and exports of gold (explanation here). The New York Fed’s GDP Nowcast estimates first-quarter real GDP growth at +2.9%.
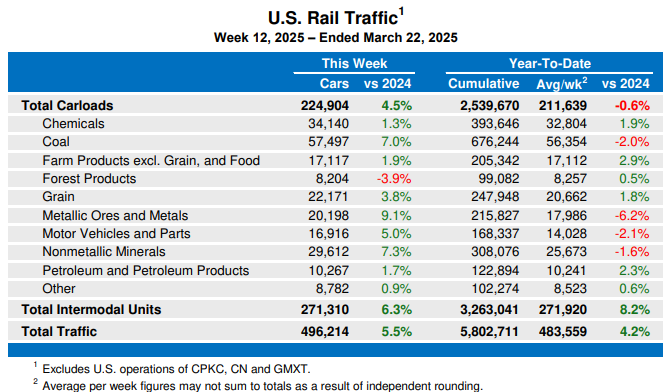
The Association of American Railroads (AAR) reported US railroads saw total combined rail traffic increase 4.2% through the first 12 weeks of 2025 compared to last year. The combined rail traffic figure includes cumulative carload volume down 0.6% and intermodal units up 8.2%. In the most recent reporting week, nine of the ten carload commodity groups posted increases compared to the same week last year. Forest products were the only commodity group to post a year-over-year decline.
The American Trucking Associations’ Truck Tonnage Index rose 3.0% in February, following a 0.1% increase in January. On a year-over-year basis, the index rose 0.6%. Trucking is an excellent barometer of economic activity, representing more than 70% of U.S. goods transported. A recovery in the goods sector appears to be underway.

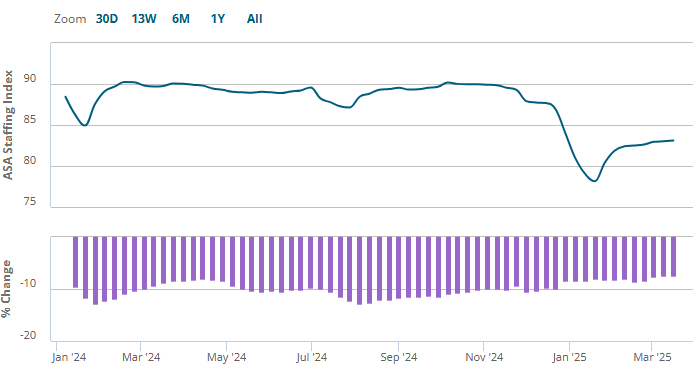
The American Staffing Association (ASA) Staffing Index shows that staffing trends are holding steady, although the four-week moving average is 7.4% lower year-over-year. We follow temporary staffing levels because short-term staffing changes typically occur before changes in full-time staffing. Temporary staffing has shown more weakness than unemployment insurance claims, nonfarm payrolls, and unemployment for more than a year.
HOUSING MARKET UPDATE
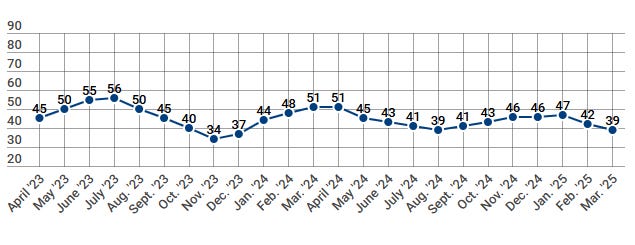
The NAHB/Wells Fargo Housing Market Index (HMI) measures conditions in the single-family housing market. The index fell 3 points in March from 42 to 39, declining rapidly over two months to the lowest level in seven months. HMI Index readings above 50 are indicative of favorable single-family home builder sentiment. The current sales conditions index fell 3 points to 43, the measure of sales expectations over the next six months was unchanged at 47, and the prospective buyer traffic index declined 5 points to 24. The NAHB Chief Economist noted “that builders estimate a typical cost effect from recent tariff actions at $9,200 per home. Uncertainty on policy is also having a negative impact on home buyers and development decisions.” Regionally, the Northeast remained the strongest, falling 3 points to 54. The South fell 4 points to 42. The Midwest fell 3 points to 42, and the West remains the weakest, falling 2 points to 37. The homebuilder index has fallen back to its 2024 low and is just above its 2023 low.
INFLATION UPDATE
The Fed’s preferred inflation measure is the personal consumption expenditures (PCE) price index. In February, the headline PCE inflation rate was 2.5% year-over-year. The core PCE inflation rate, which excludes the volatile food and energy components, was 2.8% year-over-year in February. The 3-month annualized core PCE inflation rate jumped to 3.6% annualized and the 6-month annualized core PCE inflation rate rose to 3.1%. The reacceleration in the pace of core PCE inflation above 3% will keep the FOMC on hold unless the labor market deteriorates significantly.
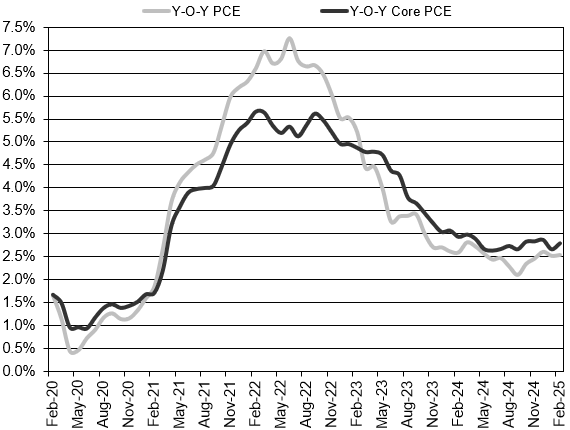
Headline PCE:
+0.3% seasonally adjusted in February, following 0.3% in January
+2.5% year-over-year
+3.9% latest 3 months annualized
+3.1% latest 6 months annualized
Core PCE: (excludes food and energy)
+0.4% seasonally adjusted in February, following 0.3% in January
+2.8% year-over-year
+3.6% latest 3 months annualized
+3.1% latest 6 months annualized
FEDERAL RESERVE UPDATE
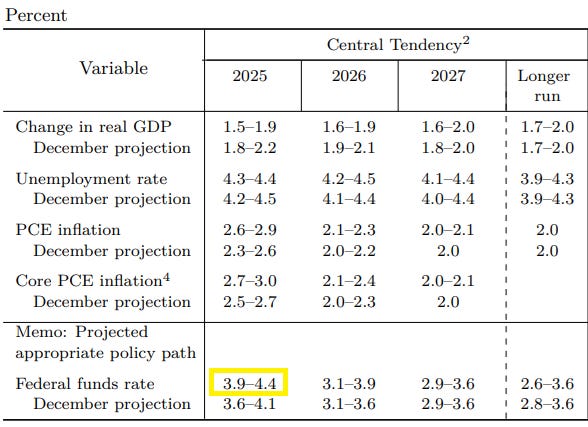
The next FOMC Meeting is scheduled for May 6th and 7th. At the March meeting, FOMC members voted to keep the fed funds rate unchanged at the 4.25% to 4.5% target range. The Fed also voted to slow the pace of quantitative tightening (QT), which decreases the overall size and scope of the Fed’s balance sheet. “The Committee will continue reducing its holdings of Treasury securities and agency debt and agency mortgage‑backed securities. Beginning in April, the Committee will slow the pace of decline of its securities holdings by reducing the monthly redemption cap on Treasury securities from $25 billion to $5 billion. The Committee will maintain the monthly redemption cap on agency debt and agency mortgage-backed securities at $35 billion.”
In the March 2025 Summary of Economic Projections, FOMC members raised their forecasts for the fed funds rate at year-end 2025. The central tendency increased from a range of 3.6%-4.1% to a range of 3.9% to 4.4%. This indicates anywhere from zero to two rate cuts between now and year-end. As you can see in the table below, real GDP forecasts for 2025 were lowered, unemployment rate forecasts increased, and inflation forecasts rose.
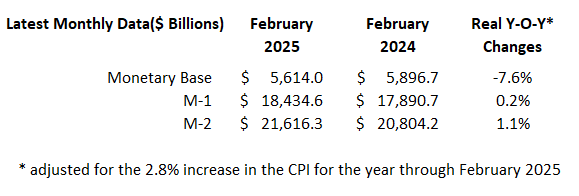
MONEY SUPPLY
MODEL PORTFOLIOS UPDATE
Below is the monthly update of the Marketimer and Brinker Fixed Income Advisor Model Portfolios through March 31, 2025.
Keep reading with a 7-day free trial
Subscribe to Brinker Advisor to keep reading this post and get 7 days of free access to the full post archives.